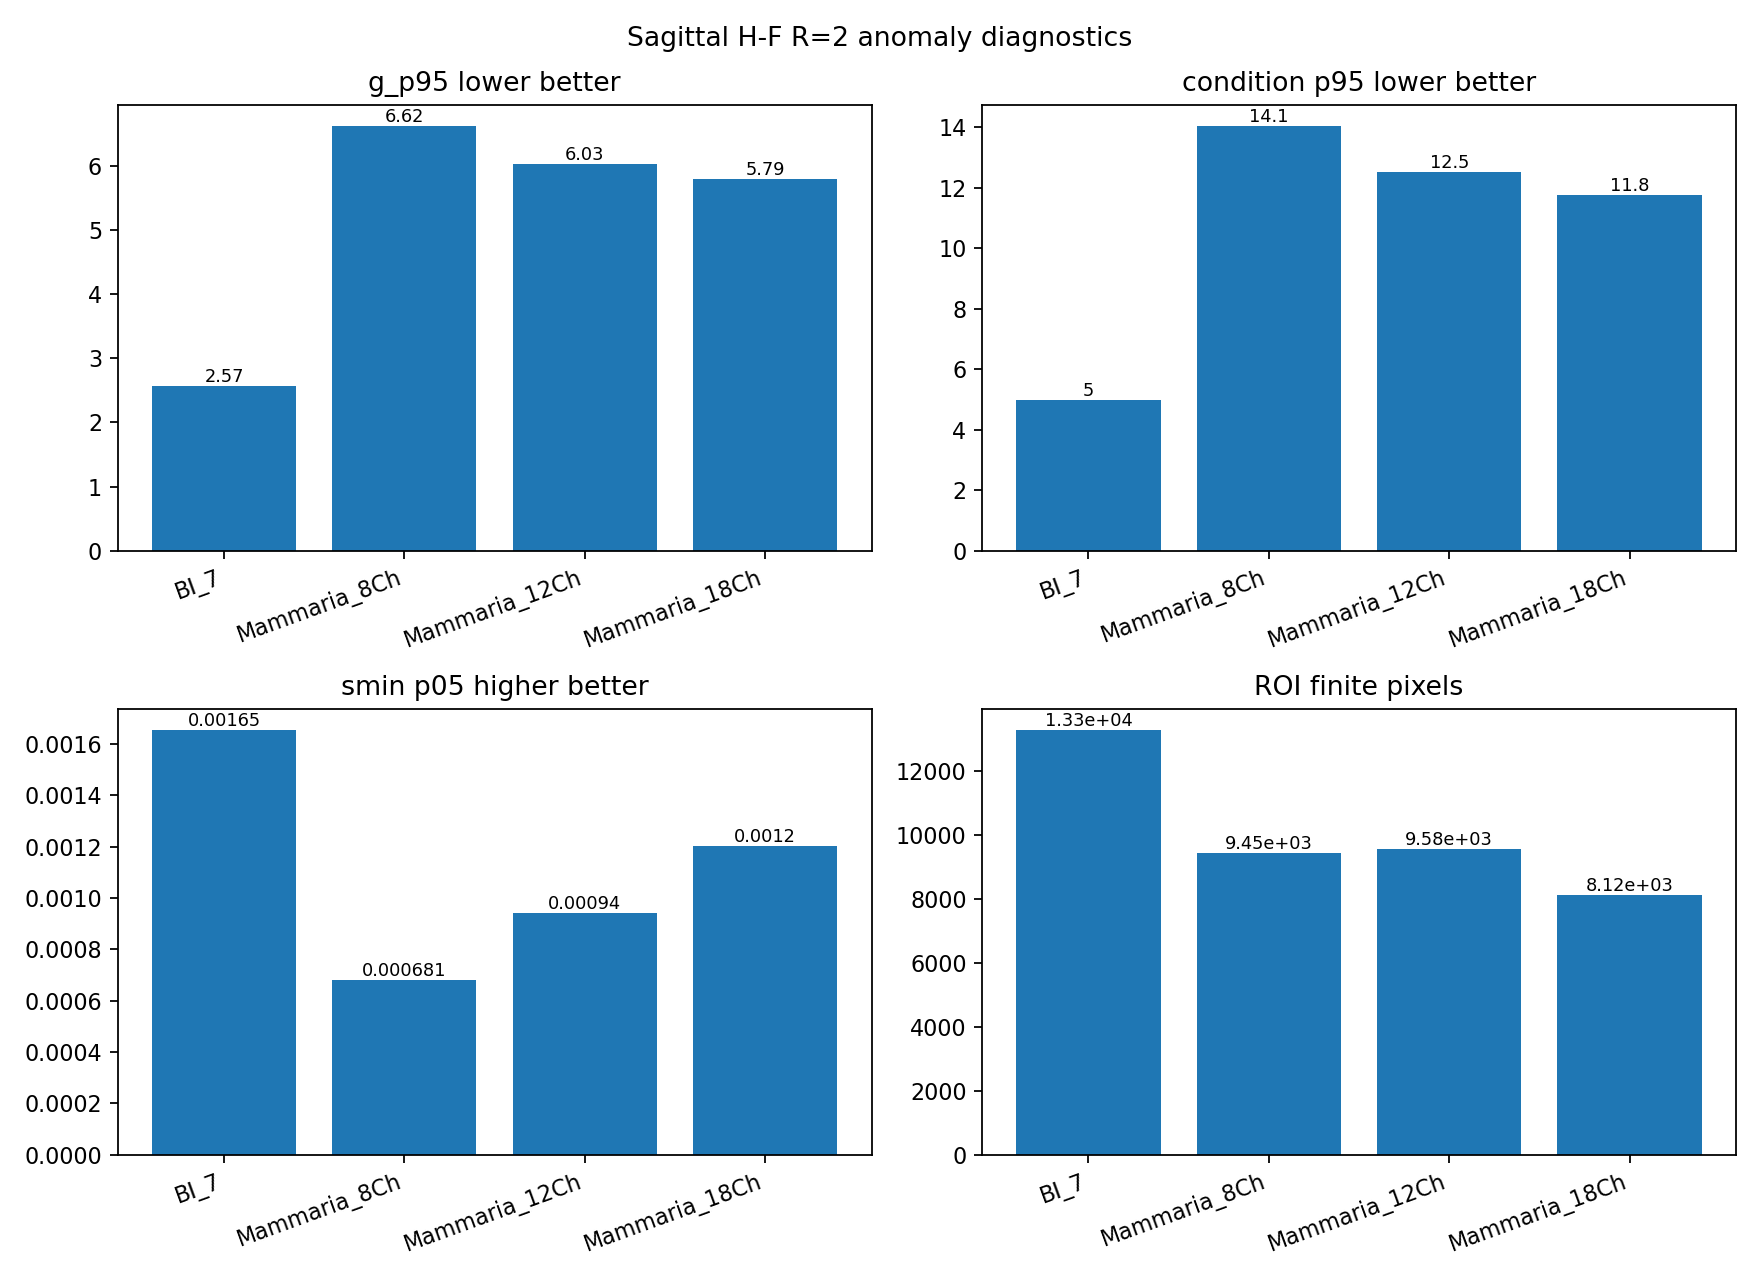
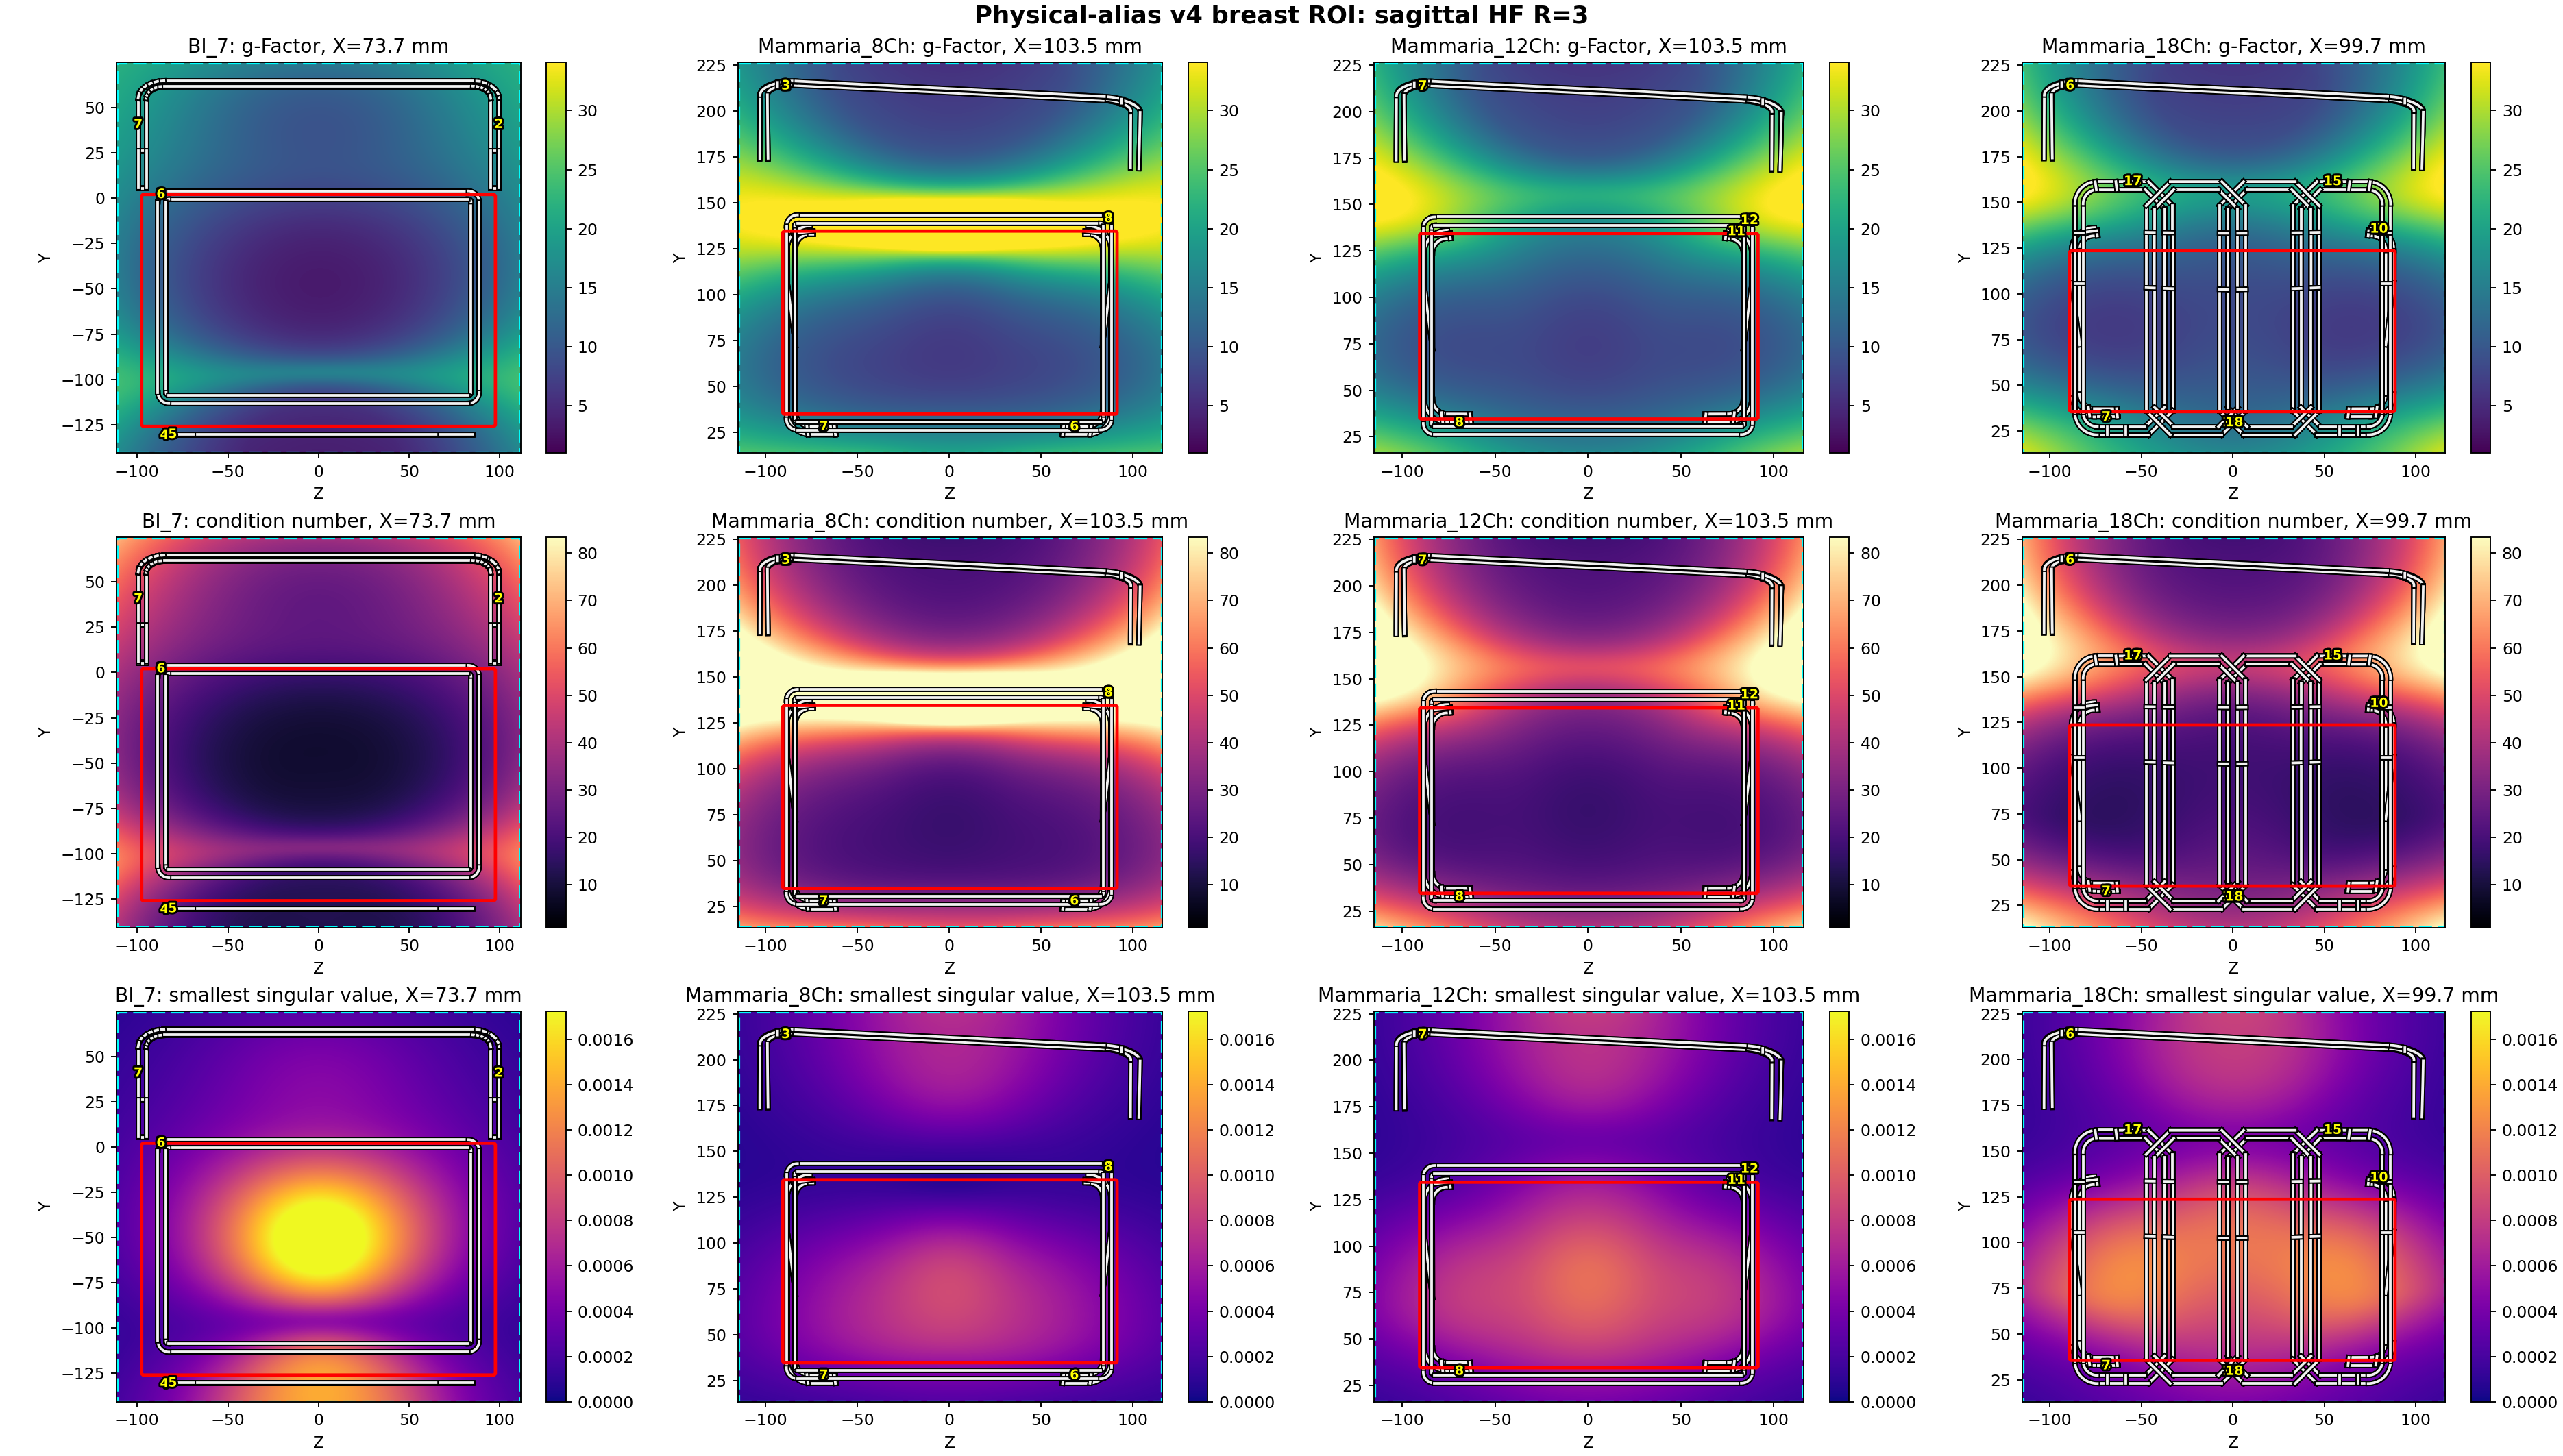
Four-panel diagnostic
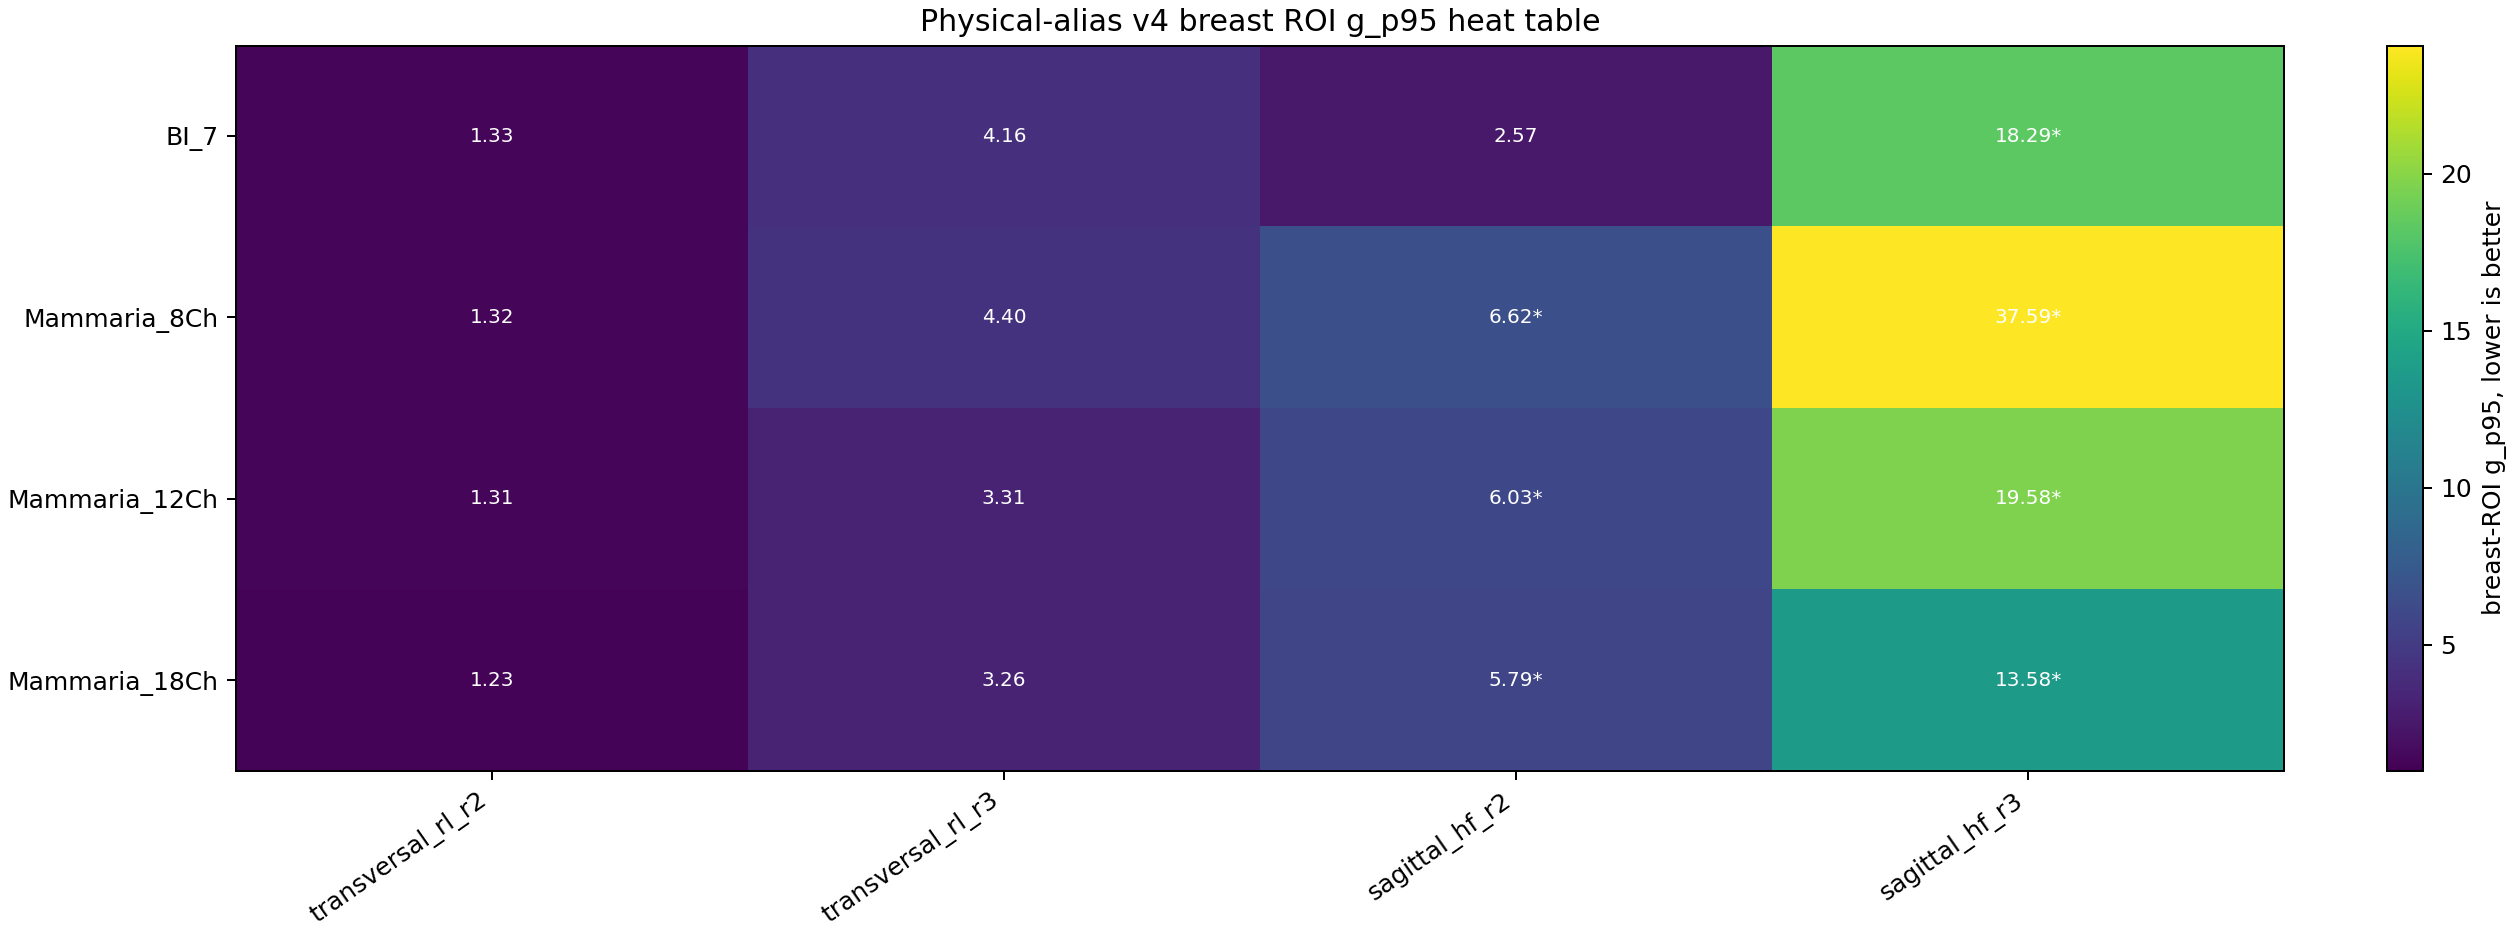
Source heat table
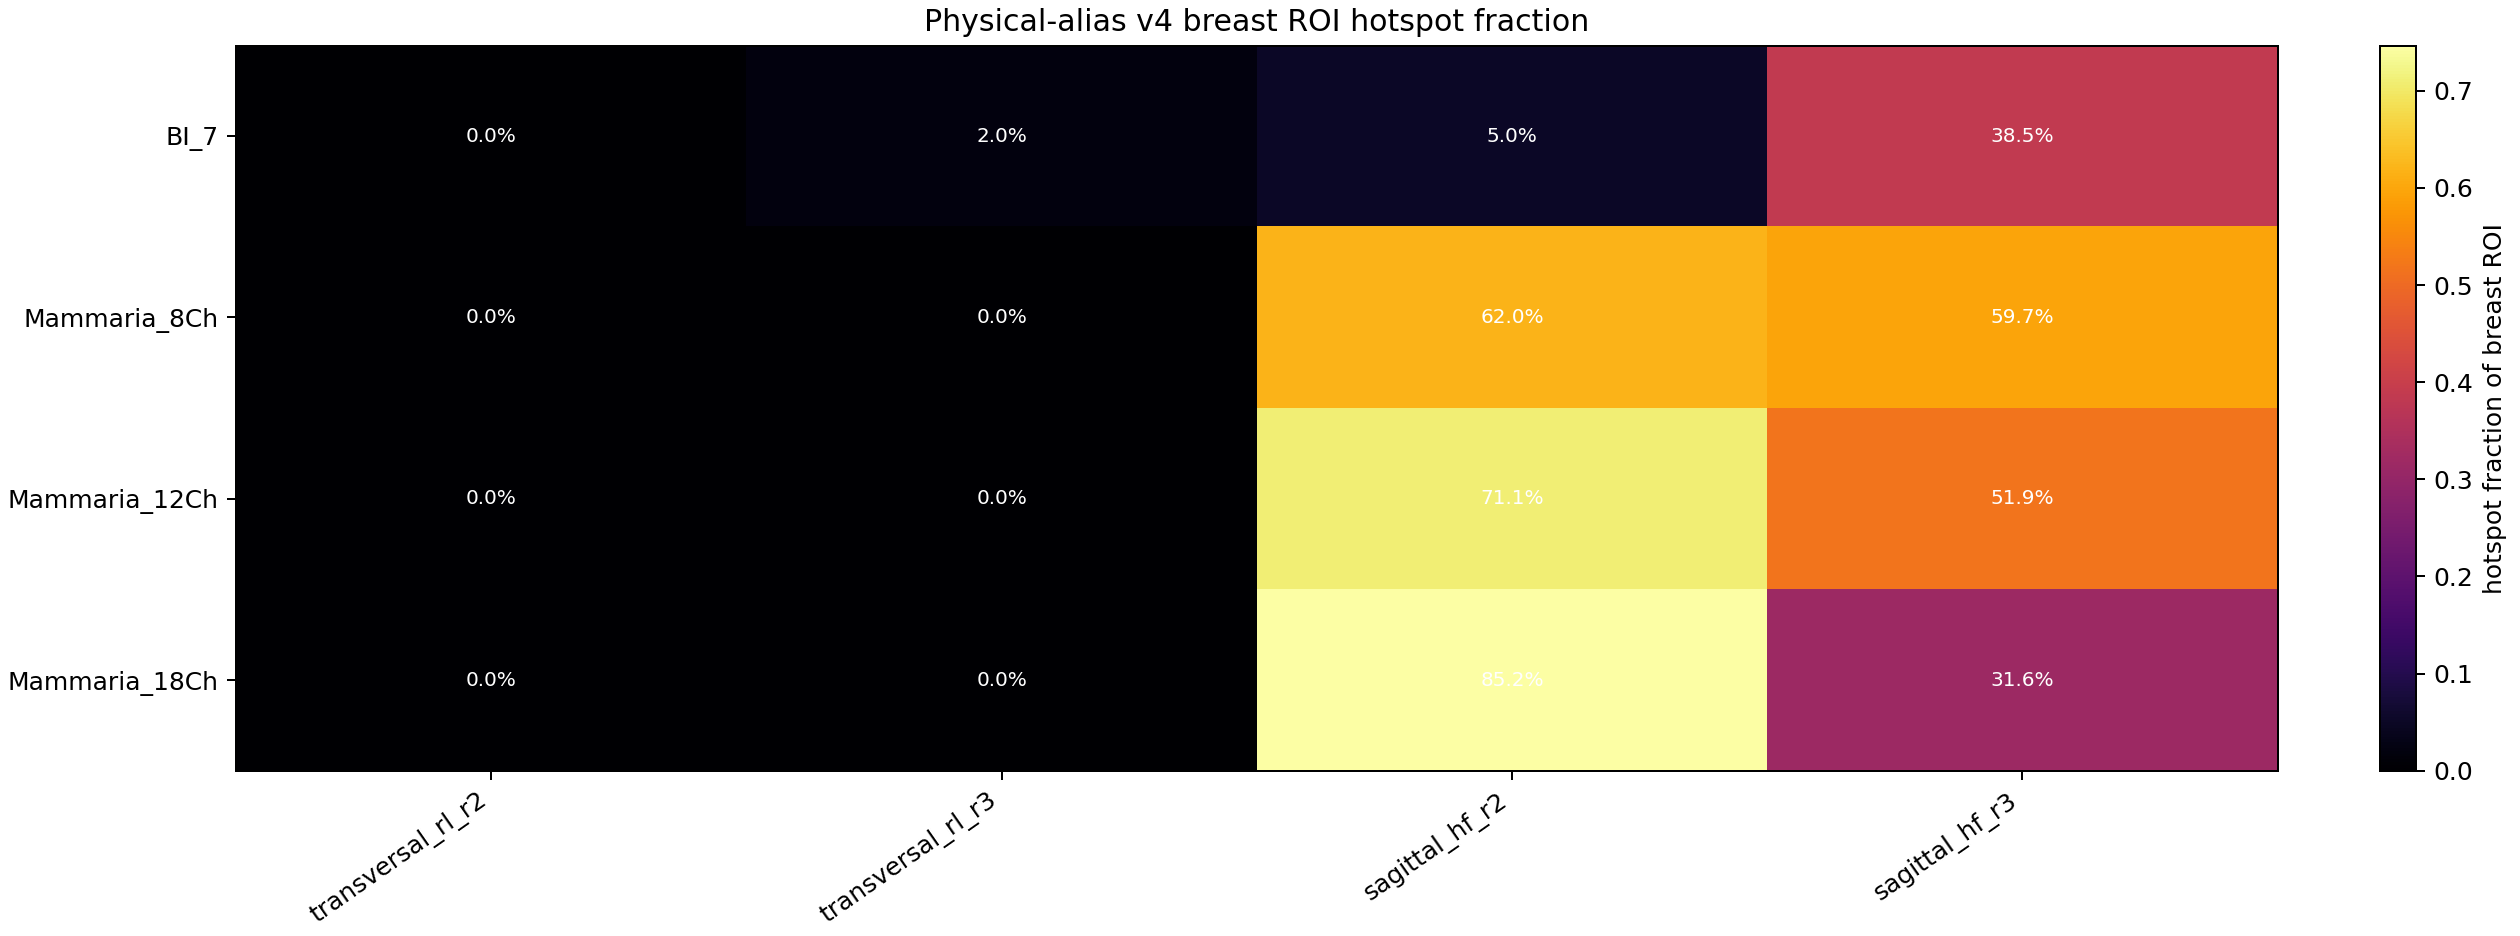
Source hotspot summary
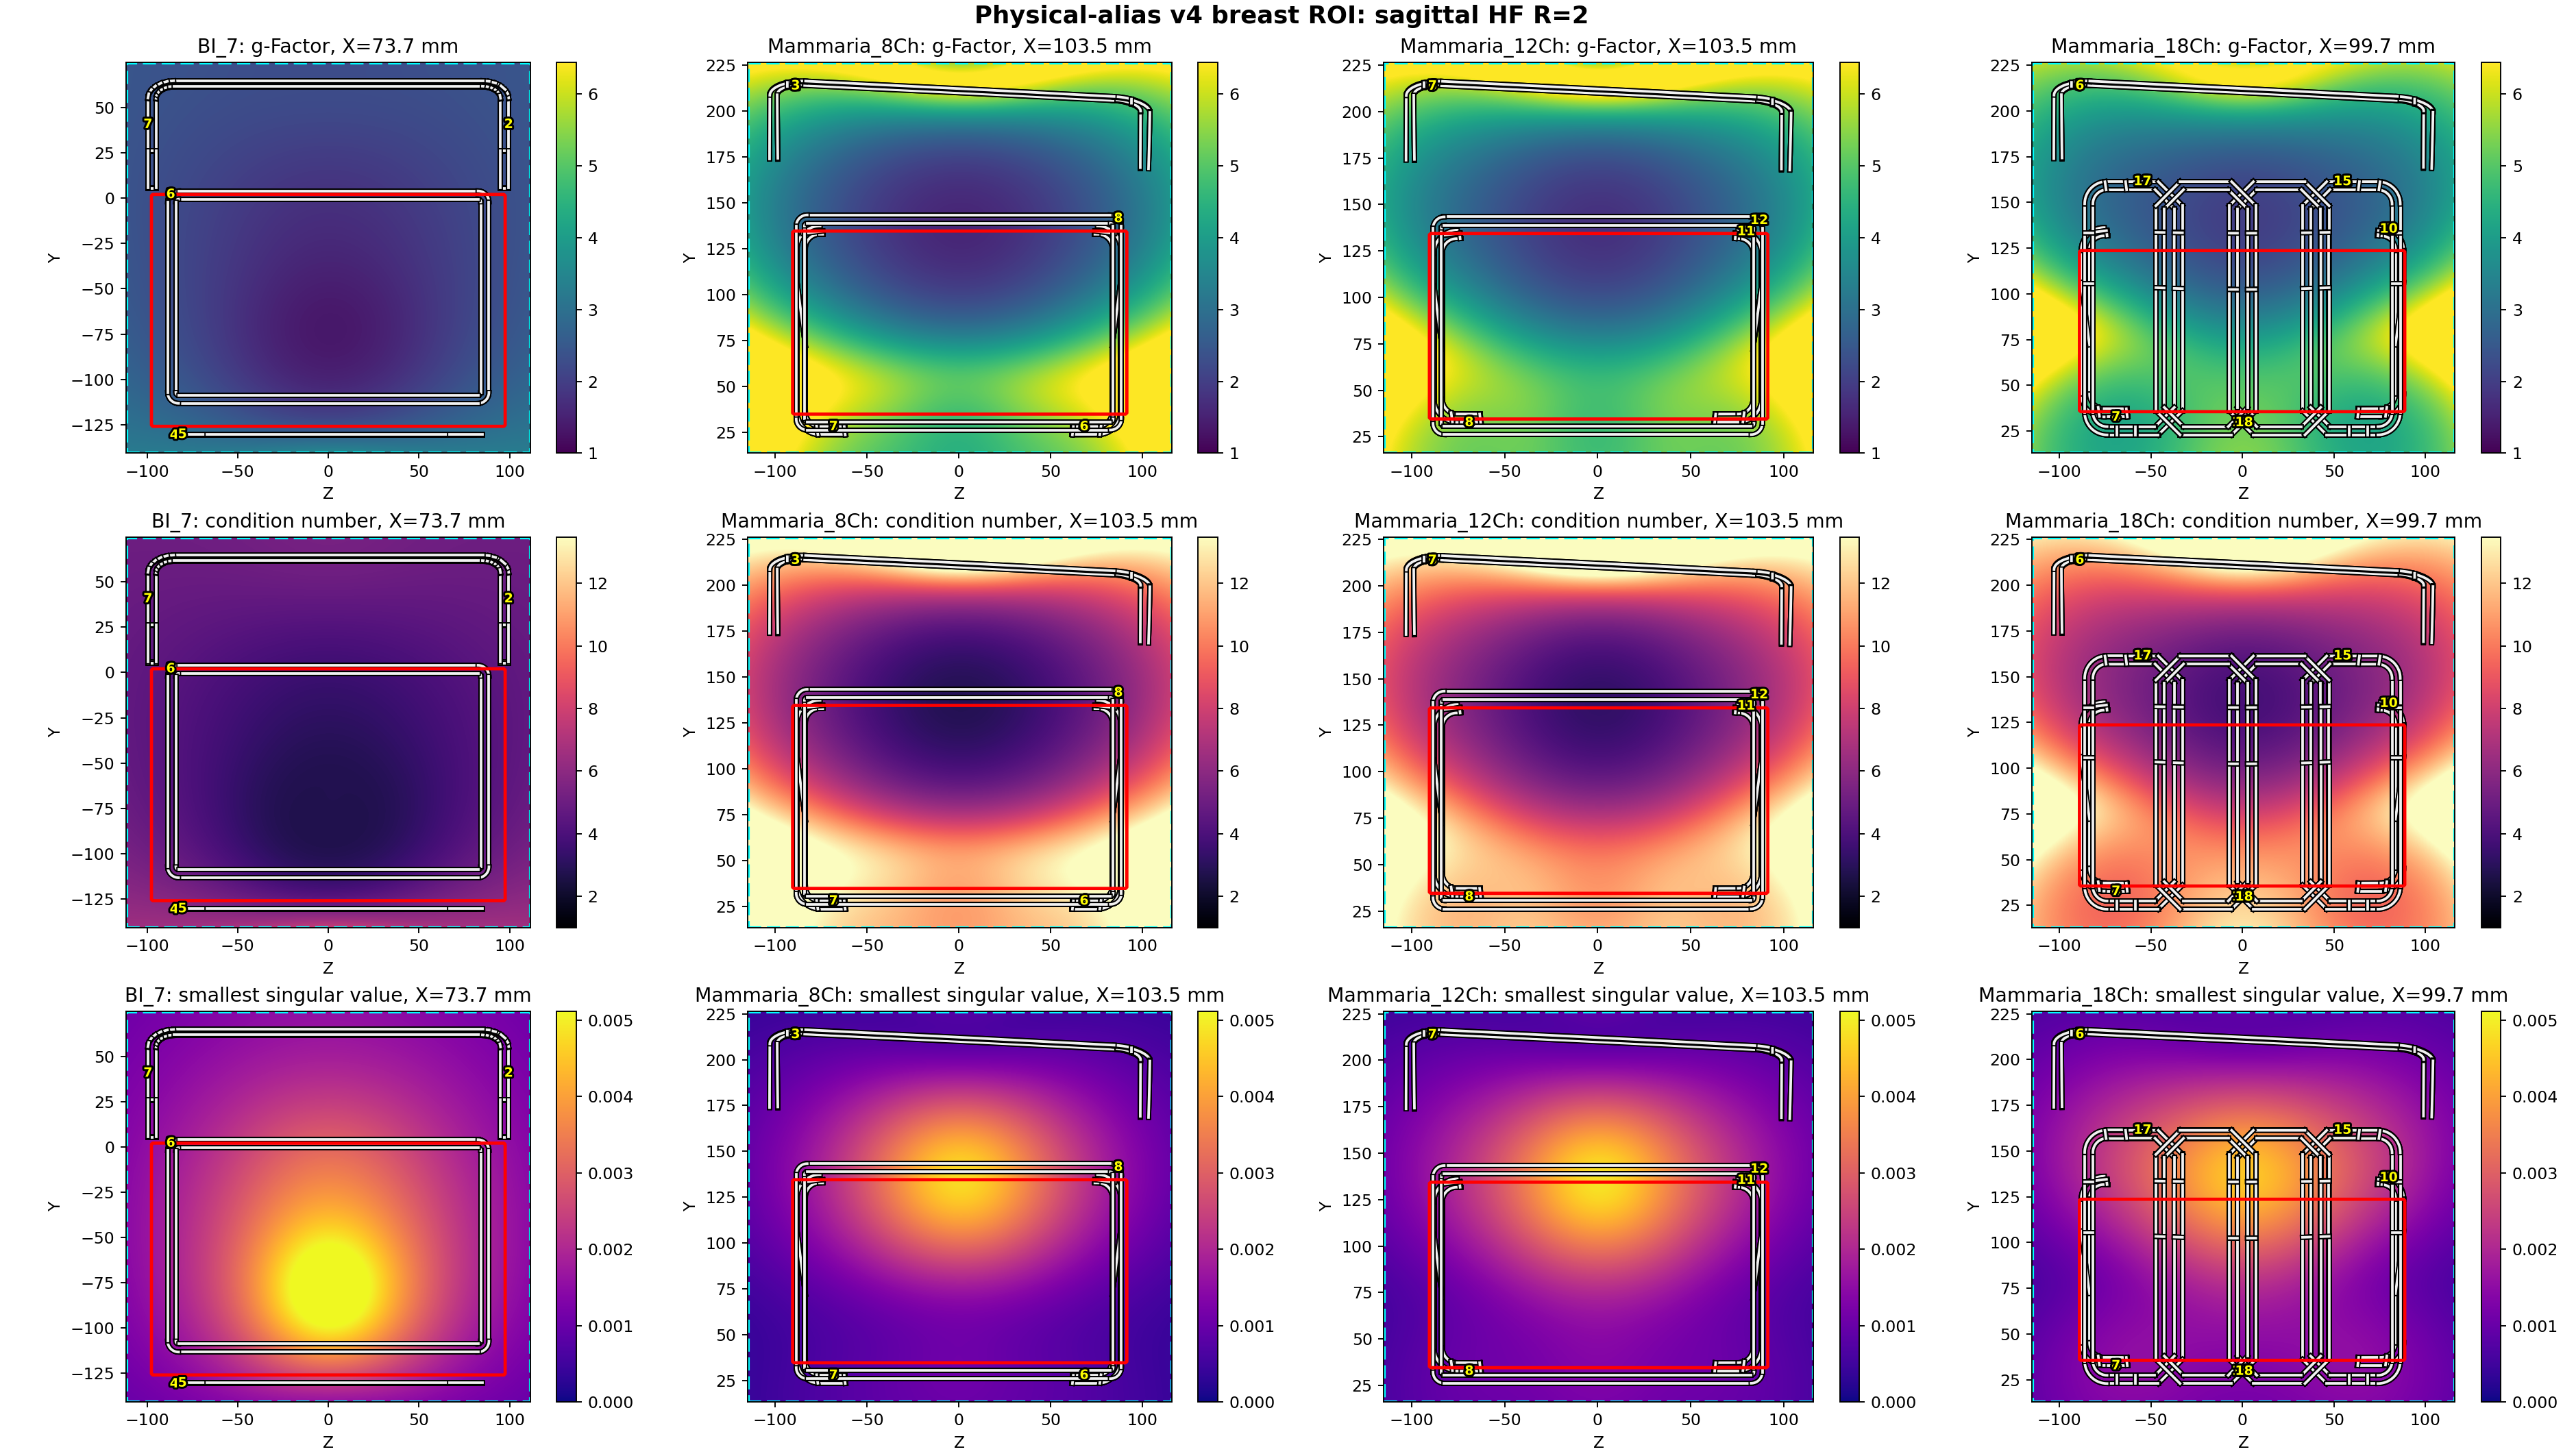
Source sagittal H-F R=2 map
Source sagittal H-F R=3 map
Generated: local Esche diagnostic run
Question: Why does BI_7 look best for sagittal_hf_r2, while Mammaria_18Ch is expected to be stronger from channel count and geometry?
Status: Not final. This is a diagnostic page. Do not use the current heat table as final product story until ROI/model/formula causes are resolved.
| Setup | g_p95 | cond_p95 | smin_p05 | ROI pixels | ROI Y range | ROI Z range | corr(g,cond) | corr(g,1/smin) | hotspot table |
|---|---|---|---|---|---|---|---|---|---|
| BI_7 | 2.565 | 4.998 | 0.001655 | 13300 | -125.8..1.595 | -97.47..97.47 | 0.9935 | 0.9515 | |
| Mammaria_8Ch | 6.622 | 14.05 | 0.0006813 | 9450 | 34.92..134 | -90.4..91.41 | 0.9966 | 0.9853 | |
| Mammaria_12Ch | 6.033 | 12.51 | 0.0009403 | 9576 | 34.65..133.8 | -90.4..91.41 | 0.996 | 0.9835 | |
| Mammaria_18Ch | 5.795 | 11.77 | 0.0012 | 8118 | 35.7..123 | -88.95..88.51 | 0.988 | 0.9762 |
cond_p95 and smin_p05, the simplified model is genuinely favoring BI_7 in this ROI/slice and we must inspect the sensitivity model and slice/ROI definition.g_p95 but not better condition/smin, the g-factor formula or normalization is suspect.